National adaptation plan progress reports
National insights relevant for adaptation planning
Metrics on exposure and vulnerability to climate-related hazards
11 August 2026
About this report
This report provides a high-level picture of exposure and vulnerability to selected climate-related hazards across Aotearoa New Zealand, to support national adaptation planning and decision-making.
It is a companion report to, and was published alongside, our 2026 progress assessment on the national adaptation plan.
It contains insights about:
- exposure to flooding, landslides and extreme heat
- isolation due to coastal flooding
- social vulnerability of communities affected by climate-related hazards
- availability of insurance.
By understanding the extent to which people and infrastructure are exposed to climate hazards, decision-makers at all levels can make informed decisions on where to focus adaptation efforts.
We commissioned external providers to gather data for each metric in this companion report. These are also available on this page.
Details & links
National insights relevant for adaptation planning: Metrics on exposure and vulnerability to climate-related hazards (August 2026)
978-0-473-79812-3 (Online)
This report provides a high-level picture of exposure and vulnerability to selected climate-related hazards across Aotearoa New Zealand, to support national adaptation planning and decision-making.
This report is an important step towards building a more quantitative picture of risk at a national level that can inform the measurement of adaptation progress. It is focused on key aspects of risk, particularly exposure and vulnerability, that are relevant to adaptation planning.
It builds on the national metrics developed for the 2024 progress assessment. These metrics have been updated and expanded with some additional measures.
This report also complements and builds on the second national climate change risk assessment for Aotearoa New Zealand. The metrics in this report touch on multiple areas relevant to the risks identified in the 2026 risk assessment.
The report provides national and district-level insights that can support national-level adaptation planning.
It’s important to note that more detailed local data will be needed to support planning and decision-making at a community level.
Communities need to be involved in deciding the best actions for their local circumstances. The high-level information in this report can support decision-making about Aotearoa New Zealand’s adaptation needs but does not recommend specific actions to address climate related hazards.
This is the first time the Commission has published this work as a separate report.
This report begins to establish a baseline and approach for ongoing monitoring.
International best practice increasingly combines quantitative metrics with qualitative analysis to understand adaptation progress, which can be complex.
Measuring adaptation requires metrics that can be linked to clear adaptation objectives and outcomes, so changes can be tracked over time and across different locations.
The Commission will continue to refine and expand the suite of national metrics as this work develops.
The national insights report contains maps that highlight how certain districts are exposed to current and future climate-related hazards.
Example map from the report (showing people, homes and community buildings exposed to inland flooding with a 1% annual exceedance probability at 1°C of warming)
How do I read the maps?
There are two types of maps for most hazards: one highlighting population and community exposure, the other highlighting infrastructure exposure.
The shading represents the share of the population exposed, or the average share of infrastructure exposed.
What information underpins these hazard maps?
The underlying exposure information was provided by Earth Sciences New Zealand.
This assessment only focuses on exposure and does not assess potential for an asset to be damaged. For example, an asset might be exposed but sufficiently robust to withstand that level of exposure.
Buildings are considered exposed to flooding if there is more than 5 cm of water around 50% of the perimeter. For other linear infrastructure, such as roads and pipelines, any part that overlaps with the hazard and is within 5 cm of water is considered exposed. For landslides, any part of an element that overlaps with the hazard is considered exposed.
For both inland flooding and rainfall-induced landslides, the baseline period is 1986–2005, centred on 1995. This baseline period is already approximately 1°C warmer than pre‑industrial (1850–1900) conditions. Therefore, the 1°C threshold has already passed. Today’s climate is already 1.4°C above pre-industrial levels. For clarity and consistency with international norms, we have chosen to express the baseline centred on 1995 as 1°C pre-industrial.
Also note that sea-level rise has already occurred, and the use of a 0.0 m 2005 baseline obscures approximately 0.2 m of sea-level rise that has already happened since pre-industrial times.
What is the key information from the maps?
Inland flooding
Inland flooding is one of the most frequent and widespread natural hazards in many parts of New Zealand.
Population
At 1°C of warming, 15.1% of the population is already exposed to inland flooding
At 2°C of warming, it increases to 16.2% of the population
At 3°C of warming, it increases to 17.2% of the population
Infrastructure
At 1°C of warming, 18.8% of roads are exposed to inland flooding
At 2°C of warming, this increases to 19.8% of roads
At 3°C of warming, this increases to 20.7%
Rainfall-induced landslides
Landslides have been described as New Zealand's deadliest natural hazard because they cause more fatalities and drive more insurance claims than earthquakes, flooding, tsunamis, or eruptions.
Population
At 1°C of warming, 1.6% of the population are exposed to rainfall-induced landslides
At 2°C of warming, this increases to 2.2% of the population
At 3°C of warming, this increases to 3.0%
Infrastructure
At 1°C of warming, 7.1% of roads are exposed to rainfall-induced landslides
At 2°C of warming, this increases to 9.0% of roads
At 3°C of warming, this increases to 10.8% of all roads
Coastal flooding
New Zealand's large coastal population makes coastal flooding an important hazard for New Zealand, particularly in the context of rising sea levels.
Population
Currently, 0.6% of the population are currently exposed to coastal flooding.
At 0.5m sea level rise, this increases to 1.8% of the population
At 1m sea level rise, this increases to 3.3% of the population
Infrastructure
Currently, 2.0% of waste and stormwater pipelines are exposed to coastal flooding.
At 0.5m sea level rise, this increases to 4.1%
At 1m sea level rise, this increases to 6.7%
The National Climate Hazard Exposure Census contains information about exposure to climate-related hazards in Aotearoa New Zealand. Through it, Earth Sciences New Zealand establishes a baseline of climate-related hazard exposure, quantifying the population, buildings, infrastructure and land exposed to a range of climate-related hazards.
Download:
National Climate Hazard Exposure Census [PDF, 13.7 MB]
Supplementary data [.ZIP, 2.89 MB]
Exposure to climate-related hazards workbook [XLSX, 361 KB]
This report provides information, at the national and territorial authority level, on who is most at risk from coastal flooding and why they may have heightened social vulnerability.
Download:
Social Vulnerability Assessment [PDF, 6.5 MB]
Raw data (New Zealand) [XLSX, 37 KB]
Raw data (per district) [XLSX, 76.2 KB]
This report provides information, at the national and territorial authority level, on how many businesses may become isolated as a result of coastal flooding, and the sectors most affected.
Download:
Business Isolation report [PDF, 5.49 MB]
Supporting data (employer by sector) [XLSX, 309 KB]
Supporting data (employer summary) [XLSX, 42.3 KB]
This report provides information on exposure to extreme heat across Aotearoa New Zealand. It sets out a percentile measure of extreme heat, and includes future projections of extreme heat across Aotearoa New Zealand.
Download:
Future projections of extreme heat across Aotearoa New Zealand [PDF, 941 KB]
Supporting data [XLSX, 61 KB]
Executive summary
This summary is adapted from Chapter 1 of the full insights report.
Download the full report [PDF, 6.44 MB]
If you would like to access this information in another format, please email us at engagement@climatecommission.govt.nz
Overview
This report provides a high-level view of exposure and vulnerability to selected climate-related hazards across Aotearoa New Zealand.
It contains insights about exposure to flooding, landslides and extreme heat, isolation due to coastal flooding, social vulnerability of communities affected by climate-related hazards, and affordability and availability of insurance.
The high-level information in this report can support decision-making about Aotearoa New Zealand's adaptation needs, but does not recommend specific actions to address climate-related hazards. It complements, and is published alongside, the Commission's second assessment of adaptation progress – 2026 Progress report: National adaptation plan. That progress report includes recommendations for action and considerations the Government should include in future adaptation planning and implementation.
This report also complements and builds on our work for the second national climate change risk assessment, which considered how Aotearoa New Zealand's economy, society, environment and ecology might be affected by climate-related risks. Together, this work provides insights to assist decision-makers to understand, prioritise, plan and implement adaptation actions.
The information in this report describes exposure and vulnerability at a national level, focusing on current conditions and projected directions of change. Projections are not predictions, but it is useful for communities and decision-makers to consider a range of plausible future scenarios when making decisions about how to adapt to climate change.
While these metrics do not directly measure adaptation, they can provide useful insight to support national-level adaptation planning. For community-level adaptation planning, understanding national trends is useful but more specific local data will also be needed.
We developed an initial set of national metrics for our first assessment of the national adaptation plan, which was published in 2024. In this companion report we update and expand on those initial metrics to provide a broad picture of national-level exposure and vulnerability.
There is no globally accepted standard for measuring climate change adaptation, but international best practice has focused on approaches that combine quantitative metrics with qualitative analysis. This is the approach we have taken for this report. Measuring exposure and vulnerability can provide some insight into adaptation needs and progress, and can form one part of a broader picture of Aotearoa New Zealand's progress adapting to climate change.
We will continue to refine and develop the suite of national metrics in the future.
Chapter 2 of the full companion report provides more detail on the metrics and their relevance for adaptation planning.
The metrics in this report
For this report, we have drawn insights from seven metrics across four categories:
- Exposure to climate-related hazards
- People, buildings and infrastructure exposed to climate-related hazards
- Measure of extreme heat
- Isolation due to climate-related hazards
- Isolation due to coastal flooding: population and marae
- Isolation due to coastal flooding: businesses
- Social vulnerability to climate-related hazards
- Dimensions of social vulnerability
- Social vulnerability of populations exposed to or isolated by coastal flooding
- Affordability and availability of services
- Insurance availability
Overall insights
Aotearoa New Zealand is already experiencing significant exposure and vulnerability to climate-related hazards. At 1°C of global warming, a threshold that has already passed, 254,000 homes are exposed to inland flooding (based on a flooding event that has a 1% probability of occurring in any given year: see Key terms below). At the same level of warming, about 77,800 people and 44,300 homes are exposed to rainfall-induced landslides.
Even for those people who are not directly affected, many tens of thousands could become isolated by climate-related hazards. For example, flooding can cut off access routes to properties that are not themselves flooded. The harm arising from climate-related hazards will vary from one community to the next, and from person to person, depending on factors such as age, health, financial security, social connections, and so on.
The number of people exposed to climate-related hazards is projected to grow as global temperatures increase and sea levels rise. This is true for inland and coastal flooding and for other hazards. For example, extreme heat is projected to increase significantly in coming decades.
Understanding who is exposed to climate-related hazards, how they might be affected and how this is changing over time is one step towards supporting effective adaptation. Together with other evidence, measures of exposure and vulnerability can inform decisions about where adaptation action is needed, and provide some insight into the effectiveness of those actions.
Both for planning and for monitoring, more detailed local-level information will also be needed, together with other evidence that more directly addresses the effectiveness of adaptation efforts.
Exposure to climate-related hazards varies between districts and will change over time
There is considerable variance across Aotearoa New Zealand in terms of exposure and vulnerability to climate-related hazards, and in terms of potential changes over time. In particular:
- Current exposure and changes across time: Some districts have significant numbers of people, buildings and infrastructure already exposed to climate-related hazards. For others, exposure is projected to increase rapidly as temperatures and sea levels rise.
- Multiple hazards: Some districts are already exposed to multiple different climate-related hazards, while others are likely to be exposed to multiple hazards in future.
- Indirect and cascading risks: In some districts, people, communities and businesses could become isolated due to coastal flooding even if they are not directly affected, as vital transport routes are cut off affecting access to essential services.
- Social vulnerability: Some districts have high levels of exposure to climate-related hazards, combined with significant numbers of people who may be likely to experience harm – for example because of age, health conditions, economic insecurity or other factors. This points to hot spots where climate-related hazards may cause disproportionate harm, and where populations may have limited capacity to adapt.
- Absolute and relative exposure: In some districts a large proportion of people, businesses, infrastructure or marae are exposed to climate-related hazards, but the total numbers exposed are relatively small. In larger cities the proportion of people exposed to climate-related hazards can be relatively modest, but the absolute numbers exposed are large. When developing adaptation policy, it is important for decision-makers to be aware both of overall directions and patterns of change, and of the specific characteristics and needs of communities.
Adaptation responses will need to be tailored to each district’s unique circumstances and informed by specific local data together with qualitative evidence about local needs. Some examples of variation across districts, and of the interactions between exposure and vulnerability, include:
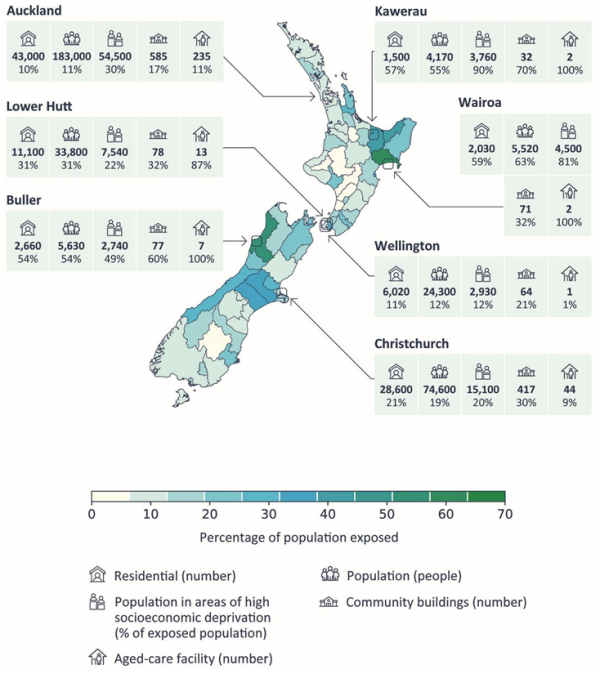
- Of all districts, Auckland has the largest total population and amount of infrastructure exposed to inland flooding and landslides, even though the proportions exposed are lower than for many other districts. Auckland also has the largest total population exposed to inland flooding while also living in areas of high socioeconomic deprivation.
- Christchurch has the highest total number of people currently exposed to coastal flooding and the second largest population exposed to inland flooding. Some Christchurch suburbs (CBD and Woolston) show signs of insurance becoming less available.
- Whangārei ranks second highest nationally in terms of population exposed to landslides, both in absolute terms and as a proportion of the population. Whangārei also ranks highly in terms of infrastructure exposed to landslides. The number of extreme hot days in Whangārei is also projected to increase substantially in the future. Just over one in five Whangārei residents is aged over 65 years, and a high proportion of those live alone. Age, together with other factors such as underlying health conditions and mobility, can make people more likely to experience harm from hazards such as flooding.
- A high proportion of Napier’s population and infrastructure is exposed to inland flooding and coastal flooding. A high proportion of Napier’s businesses could become isolated by coastal flooding. A large proportion of Napier’s population also experiences high levels of social vulnerability.
- Thames–Coromandel and Buller districts rank consistently high across exposure and social vulnerability metrics.
Key terms
Degrees of warming
In this report exposure to inland flooding and landslides is assessed at three levels of global warming: 1°C, 2°C and 3°C above pre-industrial levels (pre-industrial being the period from 1850–1900). Today’s climate is already 1.4°C above pre-industrial levels.
We use 1°C of warming as the baseline for our assessment, reflecting actual measurements from the period between 1985 and 2014. When we say locations are ‘already’ exposed to inland flooding or rainfall induced landslides, we mean they were exposed at 1°C of warming. The 2°C and 3°C degree thresholds could be passed in future. Exactly when depends on a range of factors including global action to reduce emissions.
Exposure to and isolation due to climate-related hazards
This report analyses exposure to and isolation resulting from climate-related hazards such as coastal flooding, inland flooding and rainfall-induced landslides. In this report when we say a district is ‘exposed to’ or ‘could become isolated by’ a hazard, we mean it is exposed during a 1% ‘annual exceedance probability’ event (that is, an event with a 1% or greater probability of occurring in any given year).
Sea-level rise
In this report we define sea-level rise by comparing to a 1995–2024 baseline (with a midpoint of 2005).ii When we refer to ‘current’ sea levels we mean sea levels in 2005. When we refer to sea-level rise of 0.2 m, 0.5 m or 1.0 m, we are referring to increases relative to 2005. When we refer to ‘increments’ of sea-level rise, we mean increases of 0.2 m and 0.5 m against that 2005 baseline.
Extreme heat
Throughout this report, an ‘extreme hot day’ is one that exceeds the hottest 2% of days for that location and day during the period 1985 to 2014. While most of our metrics describe exposure at different levels of warming above pre-industrial levels, this metric projects increases in extreme heat under different climate impact scenarios (low, medium and high impact).
Insights by metric
Exposure to climate-related hazards
People, buildings and infrastructure exposed to climate-related risks
This metric quantifies the exposure of people, buildings and infrastructure to three climate-related hazards: coastal flooding, inland flooding and rainfall-induced landslides. We provide this information for both current and projected future climates. The types of buildings and infrastructure considered have been selected because of their importance for supporting well-functioning communities.
Significant insights include:
- Nationally, about 754,000 people (15.1%) and 252,000 homes (15.5%) are already exposed to inland flooding at 1°C of warming above pre-industrial levels (a threshold that has already passed: see Box 1.2).
- Nationally, about 78,000 people (1.6%) and 44,000 homes (2.7%) are already exposed to landslides at 1°C of warming above pre-industrial levels. This increases steadily as warming levels increase.
- Some districts have a high proportion of the population and/or infrastructure exposed to multiple hazards. For example, the Buller and Kaipara districts are among the top five in terms of proportion of population exposed to both inland and coastal flooding. Ōpōtiki is in the top five for proportion of population exposed to both inland flooding and landslides.
- In Auckland and Christchurch, the proportion of population and infrastructure exposed to climate hazards is relatively modest compared with smaller districts, but the absolute numbers are high. Auckland has the largest total number of people exposed to inland flooding and landslides, while Christchurch has the second largest total number of people exposed to inland and coastal flooding.
- Some communities are exposed to climate-related hazards and also face high levels of socioeconomic deprivation. For example, at 1°C of warming:
- in Auckland, about 183,000 people are already exposed to inland flooding and 54,000 (29.7%) of those live in areas of high socioeconomic deprivation
- in Wairoa, 62.6% of the population (5,520 people) is exposed to inland flooding (the highest of any district) and 81% (4,500) of those live in areas of high socioeconomic deprivation
- in Kawerau, 57% of the population (4,170) is exposed to inland flooding and 90% (3,760 people) of those live in areas of high socioeconomic deprivation.
Measures of extreme heat
This metric identifies the number of ‘extreme hot days’ that are projected to occur in different parts of the country in future.
Even though Aotearoa New Zealand has a temperate climate, many effects of extreme heat are associated with relative rather than absolute temperatures. This means that people and sectors can experience negative effects even with modest increases in seasonal temperature relative to what they are used to.
For this reason, we define an ‘extreme hot day’ by comparing to past temperatures – specifically the period from 1985 to 2014. For any location and day, an ‘extreme hot day’ is one that exceeds the hottest 2% of days recorded during that same time of year.
Extreme heat can affect people’s health and wellbeing, especially for those who are already vulnerable, for example due to age or underlying health conditions.
Extreme heat can also cause harm to ecosystems, infrastructure and economic activity.
The number of extreme hot days is expected to increase significantly in future for all climate impact scenarios (low, medium and high). More specifically:
- over the 2020–2040 period, extreme hot days are projected to occur on 4–6% of days across most of the North Island and 3–5% of days for most of the South Island
- over the 2040–2060 period, extreme hot days are projected to occur on 6–11% of days for much of the North Island and up to 14% in some parts. In the South Island extreme hot days are projected for 4–9% of days.
Isolation
Isolation due to coastal flooding: populations and marae
This metric looks at the number of people, homes and marae who could become isolated by coastal flooding (that is, during a 1% annual exceedance probability coastal flooding event: see box below). Becoming isolated refers to being cut off from emergency services, supermarkets, education, work and marae if transport networks are damaged. We consider the possibility of becoming isolated under current conditions, and at different increments of sea-level rise.
Isolation can be highly disruptive to communities. It can have significant impacts on health and wellbeing (for example, by affecting access to medical services). It can also disrupt education and economic activity, and cause significant distress.
Significant results include:
- Under current conditions, about 142,000 people (2.9%) nationally could become isolated by coastal flooding. With 0.2m of sea-level rise this increases to 183,000 (3.7%) and with 0.5m of sea-level rise to 238,000 people (4.8%).
- Under current conditions, 100 marae (9%) could become isolated by coastal flooding. That rises to 116 marae (10.9%) at 0.2m of sea-level rise, and 142 marae (13.4%) at 0.5m of sea-level rise.
- The possibility of becoming isolated varies significantly between districts. Half of people in Thames-Coromandel district could become isolated by coastal flooding with current sea levels. This rises to 65.4% with 0.2m of sea-level rise and to 77.8% with 0.5m of sea-level rise.
Isolation due to coastal flooding: businesses
Under this metric we consider the number of businesses that could become isolated due to coastal flooding. Isolation caused by coastal flooding has the potential to partially or fully disrupt business activity, with flow-on economic consequences at local and national levels.
Business isolation and the resulting economic disruption could have cascading impacts for communities – for example, by affecting incomes, access to goods and services, and longer-term business viability in some locations.
In some parts of the country, inland businesses rely on coastal transport networks and could become isolated even if they are not directly affected by floods. In some places, businesses could become isolated years or decades before they are directly exposed. This can have significant impacts on production and supply chains; for example, if suppliers cannot get produce and goods to plants and markets. Fruit growers, for example, rely on timely harvesting, processing and distribution to market, all of which can be disrupted if roads are flooded.
Significant results for this metric include:
- Many more businesses are likely to be isolated than directly exposed to coastal flooding.
- Currently, more than 15,500 businesses (3.2%of all businesses in Aotearoa New Zealand) could become isolated by coastal flooding. This number increases to 22,500 businesses (4.6%) with 0.2m of sea-level rise, and 28,900 (5.9%) at 0.5m.
- The number of coastal businesses that could become isolated varies from district to district. There are 13 districts that rate consistently highly across all sea-level rise increments. For example:
- for the Hauraki and Thames-Coromandel districts, more than 30% of businesses could become isolated at just 0.2m of sea-level rise.
- in Hauraki district, 39.9% of businesses classified as agricultural, forestry and fishing could become isolated at 0.2m of sea-level rise. A significant proportion of Hauraki businesses are in the dairy farming sector, which is particularly sensitive to being isolated.
Social vulnerability
Dimensions of social vulnerability
The impacts of climate-related hazards are not likely to fall evenly. Some people or groups may be less able to cope physically with an extreme weather event, for reasons such as age, health or physical disability. Others may be less able to recover from flooding or other events because of limited economic resources.
This metric considers various dimensions relevant to the harm that people or groups might experience from climate-related hazards, and to how they perceive and respond to risk. These are referred to as dimensions of social vulnerability. As well as age, health and disability, and financial security, they include social connectedness, skills and knowledge, housing safety and security, access to food and water, and occupation.
Understanding which groups and populations may be more likely to experience harm from climate-related hazards is an important complement to understanding exposure. While no single dimension of social vulnerability will provide a picture of whether a person will be harmed by climate-related hazards, those with multiple dimensions will be more likely to experience harm. This understanding can inform adaptation planning and action, and can also support emergency planning and response.
Significant results include:
- Between 2018 and 2023, there have been increases across some dimensions of social vulnerability nationally. This includes increases in the older adult population, and the number of older adults living alone. There has also been an increase in household crowding, number of people with poor mental health, and children experiencing food insecurity.
Social vulnerability of populations exposed to or isolated by coastal flooding
This metric brings together data about exposure to coastal flooding, and dimensions of social vulnerability of the people and communities that are exposed. An index has been created to inform this analysis – the specific hazard vulnerability index ('the index').
This index helps to identify districts where exposure and vulnerability combine to create hot spots where climate risks may cause disproportionate or inequitable impacts. This type of information is useful to highlight areas where climate-related risk might be particularly high, and where carefully targeted responses may be needed.
Districts with a high proportion of their population in the top 20% of the index (quintile five) are defined as having high levels of social vulnerability.
Significant results include:
- Nationally, nearly 29,000 people (0.6%) are currently directly exposed to coastal flooding. Approximately 7,600 of those exposed (36.3%) are defined as having high levels of social vulnerability.
- Approximately 53,000 people (1.1%) are directly exposed to coastal flooding at 0.2m of sea-level rise. Around 13,000 of those exposed (24.8%) are defined as having high levels of social vulnerability.
- Napier and Buller districts have the highest proportion of their populations that are both exposed to coastal flooding and defined as having high levels of social vulnerability.
Availability of services
Insurance availability
This metric considers households in areas exposed to inland flooding, and their access to home insurance. Access to home insurance considers both availability and affordability.
Availability of home insurance was assessed based on whether households in the affected suburbs can obtain competitive quotes for insurance (that is, two or more online quotes).
Significant results include:
- Approximately 4% of properties within flood zones are currently unable to obtain home insurance quotes from two or more insurance underwriters.
If exposure or vulnerability to climate-related hazards is not reduced, and costs of damages from these hazards start to increase, insurance companies will respond by either increasing premiums in the most at-risk locations or by withdrawing insurance coverage altogether. Information about changes in insurance availability can help to inform policy responses; for example, by showing where action is needed to reduce physical exposure and vulnerability.
More information
This concludes the executive summary. For more information, see the following sections of the full report:
- Chapter 2: About the national metrics
- Chapter 3: People, buildings and infrastructure exposed to climate-related hazards
- Chapter 4: Measure of extreme heat
- Chapter 5: I(solation due to coastal flooding: population and marae
- Chapter 6: Isolation due to coastal flooding: businesses
- Chapter 7: Dimensions of social vulnerability
- Chapter 8: Social vulnerability of populations exposed to or isolated by coastal flooding
- Chapter 9: Insurance availability